Quantile Growth Planner Quick Start Guide
Project student growth in reading and/or mathematics and access resources to support college-and-career readiness. Identify the math demands needed for entry into hundreds of careers. Explore job market data at the national and regional levels.
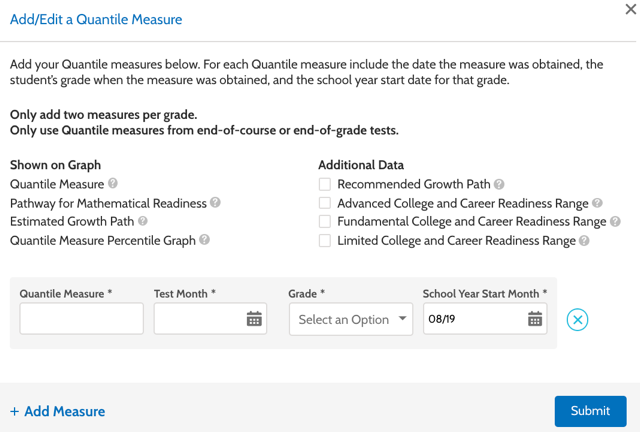
To project student growth, click the Add/Edit Measure button and enter a student Quantile measure received from an end-of-course or end-of grade assessment.
- Enter the Quantile measure into the Quantile Measure box.
- Click the Test Month calendar icon and select the month and year the test was taken.
- Select the student’s grade level the year the test was taken from the Grade list.
- Click the School Year Start Month calendar icon and select month and year school started the year the test was taken.
- Click + Add Measure to add additional measures. To receive
accurate projected results, you may add a maximum of two measures per
grade.Note: You can also select any relevant Additional Data check boxes if you want to see the data with your results.
- When you’re finished, click the Submit button.
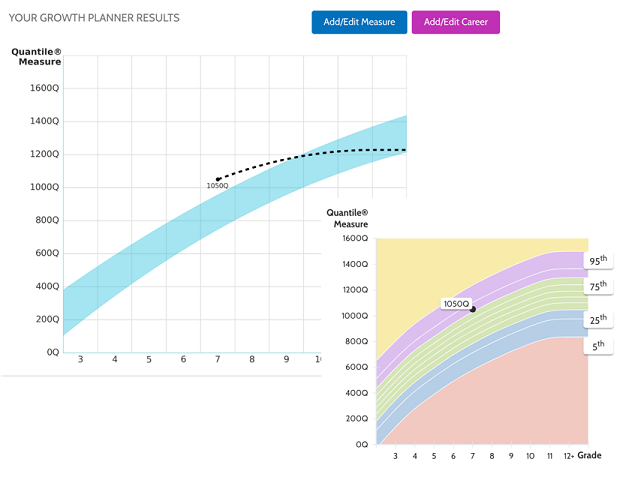
The results show the student’s Quantile measures, a green projected growth pathway that shows the range the student is expected to be in, their Estimated Growth Path and a national comparison. The Estimated Growth Path displayed is the dotted curve lying closest to the student measures entered.
You can also see a comparison of the student measure(s) to students in the same grade level across the United.
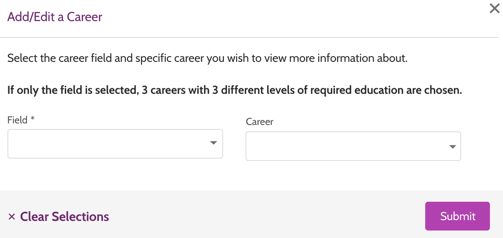
Basic+ and Premium users can compare the projected grade 12+ Quantile measure to the entry level math demand of a career. Click the Add/Edit Career button to compare.
- Click the Field box and select a career field from the
list.Note: If you enter a field, the Career list will only show careers associated with that field. You can skip this and just enter a career.
- Click the Career box and select a career from the list.
Note: If the Field box is empty, selecting a career will auto populate the field associated with that career.
- Click Submit to view the results.
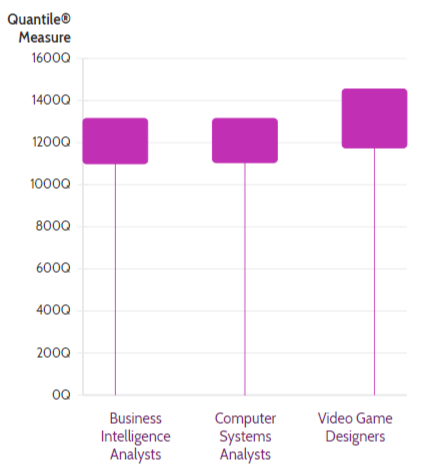
The selected career, and two others in the same field, are shown. One of the additional careers has a lower measure and the other a higher measure than the selected career. You can click on a career name to view the career’s details.
The details page provides career details like salary and projected growth. You can also see the Lexile range that is aligned with entry-level demand for the career. Click the State box, select a state, and click Search to view state data and view regional information.
- To zoom in or out of an area, use the + and - buttons at the top right of the map.
- To navigate, click and drag the map to your desired location.